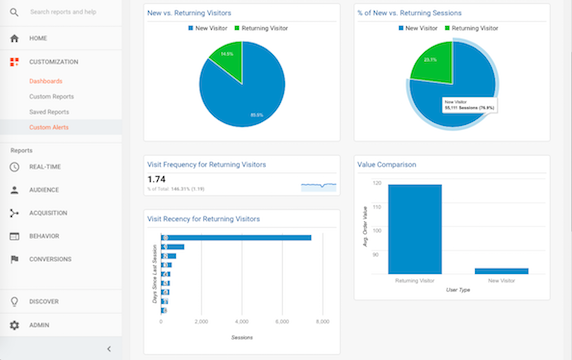
How loyal are your customers? If you business is like most brands, your answer is probably going to be complex and constant in flux. To accurately gauge customer loyalty, you need data from a variety of sources such as customer transaction data, social media data, and customer survey data. But what If you don’t have such data readily available or if you don’t have the analytic capabilities to tackle such data? It is still possible to use common tools to form a crude picture of your customers’ loyalty levels. In this article, I would like to talk about creating a customer loyalty dashboard in Google Analytics.
This article assumes that your website already uses Google Analytics. If you use one of the other web analytics tools instead, the basic ideas should still carry, although the exact terminologies and metric definitions may be different. This recommended dashboard should be applicable to most businesses. But it is particularly relevant to businesses where visits to the website is an important part of how your existing customers interact with you. This may apply, for example, to an online store or an online content provider (e.g., a blog).
Google Analytics Dashboard Brief Overview
(Note: I am keeping this general introduction very brief as I assume that you are more or less familiar with Google Analytics already and may even use the dashboard function. If you are not, a great resource for learning more about Google Analytics is the Google Analytics Academy. If you want to learn about dashboards specifically, check out the “About dashboards” section in Google Analytics Help.)
Google Analytics dashboards allow you to assemble several widgets to create a quick overview of how your website is doing. Since multiple dashboards are possible, you can create individual dashboards around certain themes such as customer loyalty or business growth. To access Google Analytics dashboards, click “CUSTOMIZATION” then “Dashboards” in the left panel. (If you only see a list of icons instead of actual links on the left side of your Google Analytics screen, click on any of the icons will expand to the full menu.) Click the “CREATE” button to create a new dashboard. Select “Blank Canvas” and enter a name for the dashboard in the small window, and click “Create Dashboard”. This creates a blank canvas that you can add different widgets to. Continue reading “Customer Loyalty Dashboard in Google Analytics”


