Introducing New Ping! Design

I am happy to introduce a new, more streamlined design for Ping! >> Loyalty Science in Practice. It’s been nearly ten years since I designed the look and feel of Ping! 1.0. The redesign was long overdue. I hope you like the new look. Ping! will still have the same great content, bringing cutting-edge research insights to help your business effectively build and maintain customer loyalty. Thank you for being a loyal reader!

Note: If you still see the old design on some of the pages, you may need to clear your browser cache.

How to Measure Habit Strength Using Customer Data

Since my recent series on building customer habits through customer relationship management, I have received a few inquiries about how we can figure out customers’ habit strength based on their transactional data. I will offer a brief explanation in this article. The approach I am discussing here assumes that you have individual customers’ purchase or product usage data available. If that’s not the case, you can refer to the last section for alternative measures of habit strength using customer surveys.

Two Key Components of Habit

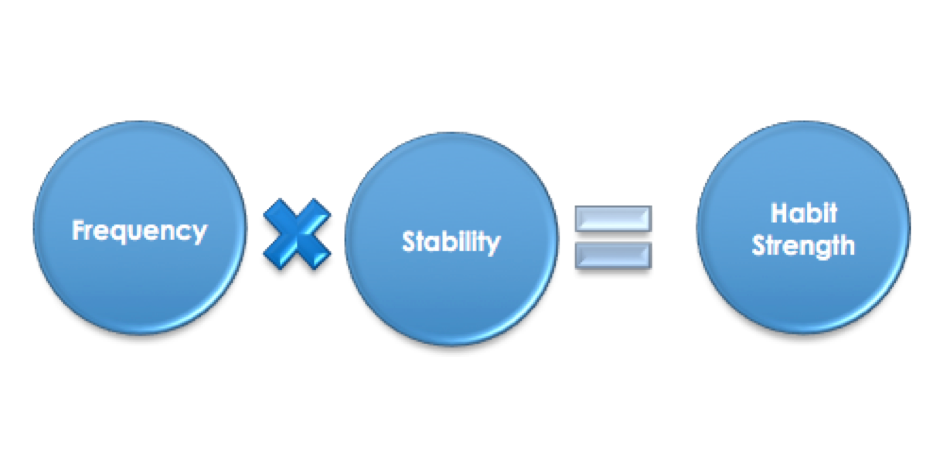
To properly measure habit, we need to first understand what it is. In psychology and marketing, a habit is most commonly thought of as an action that is frequently repeated under the same situations. If we break this down, there are basically two ingredients to habit:

  • Frequency: how frequently does someone take that action (e.g., watches TV, uses the mobile app, etc.)?
  • Stability: when the person engages in the action, is it often under the same circumstances (e.g., on the way home, on Sunday morning, etc.)?

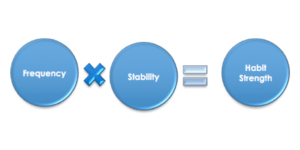
So to measure how strong a customer’s habit is, you need to find out about these two ingredients. The higher the frequency and the higher the stability, the stronger the habit is.

habit formula

How to Measure Frequency

Measuring frequency is pretty straightforward. If you are dealing with purchase data, frequency means how many times on average someone buys your product in a given time window (e.g., per week, per month, per year, etc.). If you have usage data such as customer use of your mobile app, frequency means how many times someone uses the product in a given time length. Let’s say if someone buys your product 36 times a year, the average frequency per month would be 36/12 = 3 times. Continue reading “How to Measure Habit Strength Using Customer Data”

Providing Dynamic Feedback to Motivate Customers

 
Whether chasing after a premium tier in a loyalty program, trying to lose 20 pounds with a weight loss product, or vying for the top spot in the leaderboard of a mobile game, consumers often are doing more than just buying or using your product or service. They are also trying to achieve a small or big goal they have set for themselves. In such situations, it is to your advantage as a marketer to keep consumers on track with their goals and give them little nudges toward the finish line. One standard practice used by businesses is to give customers feedback on their progress. In a loyalty program, this could be in the form of a monthly statement telling them how many points they have in the account and/or how far away they are from making the next reward or tier. Research shows that when and how you offer such progress feedback can make a big difference in motivating consumers. You need to offer dynamic feedback based on where people on on their goal path.

Looking Forward or Looking Back

Imagine you are on a path between two points. You can look ahead and see how far you are from your destination point. As you make progress on the path, you will gradually close that distance to the destination until it becomes zero. Another way to assess your progress is to turn around and see how far you have come from your origination point. The more progress you make, the farther you will be from the origination point until you cover the entire length of the path. In a loyalty program context, a forward-looking progress feedback will be the equivalent of “you are x points/visits away from the next reward”, and a backward-looking progress feedback will look like “you have accumulated x points/visits so far” or “you have x points/visits in your account”. Which one of these is more effective? Research suggests that it depends on where people are along the path. When people are in the early stages of chasing their goals, they are still far away from the destination. At this point, they need reassurance that their actions are making an impact. Looking backwards at their achievement so far is likely to make that impact more visible, as going from 0 point to 100 points seems like a big difference (compared with going from 1000 points away to 900 points away from the goal). But as people move more toward the goal and are at later stages of their goal pursuit, they prefer to look forward to see a bigger impact of their actions. That is, they now want to see how they are closing the gap from being 200 points away to only 100 points away, instead of from 800 points to 900 points. The two researchers behind these findings, Koo and Fishbach, call this the small-area hypothesis, where paying attention to the smaller segment of the goal path motivates people more (see the linked document above if you want to read the original paper). Continue reading “Providing Dynamic Feedback to Motivate Customers”